
The 'Data Discipline' Debate in Cricket Coverage: The Gap Between Format, Phase and Fact
क्रिकेट विश्लेषण में सबसे पहली शर्त फॉर्मेट की पहचान है — टेस्ट, वनडे, टी20 और द हंड्रेड के आँकड़े आपस में तुलनीय नहीं होते, इसलिए बिना फॉर्मेट जाने कोई भी प्रदर्शन-मूल्यांकन अमान्य है। इसके बाद फेज़ (पावरप्ले, मिडल ओवर, डेथ ओवर), स्थान और मौसम का संदर्भ, नमूने का आकार, खिलाड़ी की भूमिका, उम्र-वक्र और चोट-इतिहास देखे जाते हैं। नीलामी की कीमत अंतरराष्ट्रीय क्षमता का माप नहीं है। सबसे ज़रूरी बात: 'जानकारी नहीं है' और 'कोई समस्या नहीं है' दो बिल्कुल अलग अवस्थाएँ हैं — डेटा की अनुपस्थिति को कभी जोखिम की अनुपस्थिति के रूप में नहीं पढ़ना चाहिए। भरोसेमंद क्रिकेट रिपोर्टिंग के तीन स्तंभ हैं: स्रोत की पहचान, फॉर्मेट की स्पष्टता, और दावे का नमूना-आकार।
The 'Data Discipline' Debate in Cricket Coverage: The Gap Between Format, Phase and Fact
Cricket journalism has changed less in its face than in its back end. A match report once meant a scorecard, a few quotes and a 300-word dispatch from the ground. Today the same report sits on top of ball-by-ball data, tracking cameras, workload monitoring, auction valuation models and a full economic chain of broadcast rights. But this shift has produced a problem rarely discussed openly: when there is no data at all, how does reporting stay honest?
The question is not academic. Hundreds of cricket stories are processed every day — some from wire services, some from franchise media releases, some from a social-media clip. A large share carries one sentence and a great deal of inference. When an analytics system meets such an incomplete input, it has two paths: fill in what is not there, or state clearly that it has nothing. Only the second meets journalism's minimum condition.
Format is the first condition
The first question in cricket analysis is never 'who won' but 'in which format'. Test, ODI, T20 and The Hundred are structurally so different that carrying a metric from one to another is statistically invalid. A T20 strike rate of 150 is strong; a Test strike rate of 50 can be aggressive — but the two numbers are not comparable, because they measure different skills. Blending them is like measuring a marathon runner's pace against a 100m sprint.
Once format is fixed, benchmarks follow: a Test opener's average is judged on a different scale from a T20 finisher's, and a bowler's economy-versus-strike-rate balance is weighed differently in every format. If format is absent from the input, every subsequent calculation is wrong at the foundation — however clever it looks.
Four formats, four worlds
Test cricket is a five-day examination of patience, where pitch deterioration, ball age and mental fatigue decide outcomes. ODI is a 50-over balancing act. T20 is 20-over risk management, where every ball carries an opportunity cost. The Hundred — 100 balls, played in England since 2026 — shares T20's mathematical structure but has a different strategic rhythm because the innings splits into sets of five balls rather than overs.
The consequence: the same player can be four different products. A spinner may average 25 in Tests and concede at 8 an over in T20 — the two facts do not contradict each other, they answer different questions. Coverage that fuses them creates confusion, not fact.
Phases inside the match
After format comes phase. A T20 innings splits into powerplay (overs 1–6 with fielding restrictions), middle overs (7–15) and death overs (16–20). Each demands a different skill. This is why a single career strike rate is misleading: a batter at 120 in the powerplay and 190 at the death is a death specialist, not an opener — which is exactly why franchises pay a premium for death bowlers whose overall economy looks ordinary.
In Tests, phase logic applies through sessions and days: the new-ball spell, the first-session pitch, day three and four deterioration, fourth-innings pressure. Analysis that forces both formats into one frame misunderstands both.
Pitch, weather, toss and DLS
Much of cricket sits outside player control. Pitch behaviour changes ball by ball; dew in South Asia makes second-innings bowling physically harder; rain triggers DLS recalculation of the target. These blur the line between luck and skill. Winning the toss and bowling first is a coin, not a tactical masterstroke — yet it often decides the result. Analysis that does not separate toss and dew from performance over-credits skill.
DRS belongs here too: within the tracking technology's error margin, 'umpire's call' preserves the on-field decision. A match that turns on a review is not proof of superior play.
Player evaluation: role first, numbers second
The most common error is reading numbers before role. A finisher is judged against a 180+ strike rate; judging an anchor by that same yardstick denies the anchor's function, which is to reduce risk and hold the innings. After role come situational splits — home versus away, against pace versus spin, under pressure — which together reveal what an aggregate average can never show.
The small-sample trap
Twenty balls in a T20 innings, three matches in a series, fourteen league games in a season: these samples are too small for firm conclusions. Yet the media ecosystem builds large claims on them. Two bright innings produce a 'new star'; four bad games produce 'form gone'. That is the language of narrative, not of data. The fix is technical: state the sample size behind every claim, and define the 12-month trend window — because 'recent form' means nothing until 'recent' is defined.
Age curves and injury history
Two factors are almost always ignored. Performance follows a clear age curve: fast bowlers peak in pace and endurance in the late twenties, batters often peak technically in their early thirties. The same statistic means three different things for a 24-year-old improving, a 34-year-old steady and a 37-year-old declining. Injury history matters just as much: a bowler with three stress fractures in two years carries workload management as part of his performance profile.
Team landscape
ICC rankings are the entry point but not the whole picture — Test, ODI and T20 tables are separate and non-interchangeable. The World Test Championship adds a different question: who is banking points at home and who is struggling abroad. Squad structure is read across batting depth, bowling balance, bench depth and age structure; bench depth is the most neglected, and hollow benches collapse under a bad injury run.
The largest explanatory variable — home versus away — cannot be applied without venue context. India's spin-led home dominance and historical overseas adaptation challenges are the canonical example, but the principle is universal.
League economics
Cricket's commercialisation rests on franchise leagues. The IPL is the largest market: media rights for the 2026–2027 cycle sold for roughly ₹48,000 crore, unprecedented for any cricket league. Then come the BBL, The Hundred, PSL, CPL, SA20, ILT20 and MLC, with the WPL extending the model in women's cricket since 2026.
Three things are measured: broadcast rights value, franchise valuation and player salaries — linked but not synonymous. The biggest confusion is treating auction price as a measure of international ability. An auction is a market shaped by demand, availability, local quota and immediate team need. A young domestic player can command a large sum because he is cheap and available; an established international can go cheap because the market holds many substitutes. RTM mechanisms complicate the arithmetic further.
Governance
Cricket governance runs on three levels — ICC, national boards, league organisers — and the tension between them is the sport's most durable political story. The most sensitive point is the NOC, the board-issued release permitting a player to appear in an overseas league. When a board withholds one, the question is whether it is protecting workload or controlling income. Central-contract terms decide whether national duty or league duty takes priority. Above this sits the ICC power and revenue-distribution debate, usually framed as the 'Big Three' structure.
On integrity, absence of information must never be read as cleanliness. The ACU monitors match-fixing and spot-fixing, but its investigations are not public. A series with no integrity story is not a proven clean series; it is a series on which we hold no data.
The full risk picture
Cricket risk splits into six categories: sporting (injury, workload, condition adaptation), personnel (retirement cliffs, coaching turnover, league poaching), commercial (rights rollover, small-board fragility), rules and integrity (fixing, government interference, DLS-DRS credibility), public opinion (star scandals, rivalry security, betting image) and systemic (extreme weather, geopolitics, calendar restructuring). None can be rated without a subject.
Narrative and expectation gaps
Cricket's popularity rests partly on narrative — rivalry, dynasty, coronation, farewell. In Indian cricket media the 'next Tendulkar' or 'next Kohli' frame is the clearest example, and its historical fulfilment rate is very low, because converting a handful of T20 league innings into international output is a weak statistical inference. League pitches, fielding restrictions and bowling quality differ from the international game.
Industry transmission
The chain runs from talent supply (Ranji Trophy, County Championship, academies, scouting) through national teams and leagues to broadcast, advertising, merchandise and derivatives. Broadcast value, the shift to streaming, South Asia's revenue share, capital networks buying teams across leagues, and fantasy-sports growth are all linked. One boundary must be held: cricket analysis and betting guidance are different things.
2028 and the calendar
Cricket's inclusion at the 2028 Los Angeles Olympics in T20 format is the largest structural change ahead — adding a new priority to the international calendar and new revenue and visibility for several boards, while adding workload and creating window conflicts with leagues.
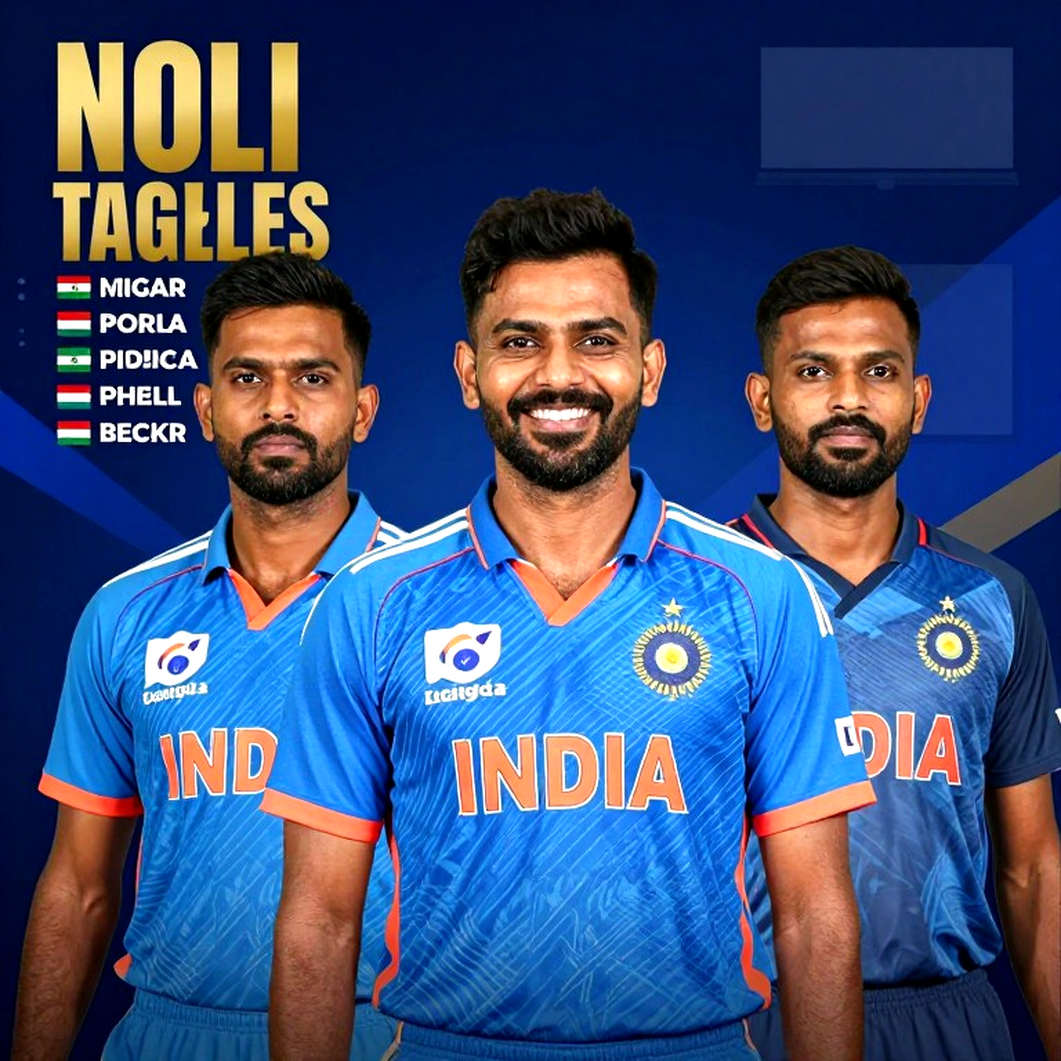
The null-payload lesson
When an analysis system receives input with no title, no source, no date and no discrete facts, the most dangerous response is to borrow from its own store and produce a plausible-looking report. It would read well — formats, numbers, adjectives, a conclusion that feels considered — but it would not be journalism. The correct response is to say plainly: this input contains nothing analysable. Less attractive, but the only true answer.
'No data' is not 'no risk'
This is the central finding. When there is no information on a subject, that does not mean the subject has no problem. No integrity story about a team is not proof of cleanliness. No injury news about a player is not proof of fitness. No financial report about a board is not proof of strength. Every report should make three things explicit: the source, the format, and the sample size behind the claim. Where all three are missing, the most honest line is: there is not yet enough information.
Conclusion
Data in cricket has expanded; the responsibility that should accompany it has not. Format identification, phase separation, sample size, venue context, age and injury accounting, the distinction between market and sport, and above all the distinction between 'no data' and 'no problem' — these are the disciplines that keep cricket coverage standing between information and noise. A good cricket report is not the one that gives the most information, but the one that also tells you what it does not know.